
You feel the impact of leverage every time you take on a new loan or consider a cash‑out refi. What is harder to see is how that debt shapes your long‑term returns. That is where connecting Loan to Value (LTV) with real performance metrics like cash flow, cap rate, and ROI turns into your edge. Rentastic gives you that connection in one place so you can see not only what you owe but how every dollar of leverage is working for you.
In this guide, you will see how to use rentastic to move from a single LTV snapshot to a clear, ongoing picture of portfolio performance.
LTV is simple. You compare your loan balance to your property value. It answers a basic question: how much of this asset do you actually own, and how much does the bank still control.
Lenders rely on LTV to judge risk. You might use it to see how much equity you can tap or how exposed you are if prices fall. Rentastic makes this quick by tracking both loan amounts and property values at the unit and portfolio level so you can see updated LTV ratios in your dashboard without touching a spreadsheet (Rentastic Blog).
On its own though, LTV does not tell you if a property is a winner. A 60 percent LTV on a unit that bleeds cash every month is not a great deal. A property at 80 percent LTV that throws off strong cash flow and long term appreciation might be far safer. You need to see leverage in context.
That is why pairing LTV with real performance metrics inside rentastic matters. You stop asking only, “How much do I owe?” and start asking, “What is this level of leverage actually doing to my returns and risk?”
You might already track LTV in a notebook or a sheet, but that usually ends up as a one‑time calculation. The value shifts, the loan amortizes, and your file goes stale. Rentastic treats LTV as a living signal that updates as the real numbers behind your properties move.
Rentastic pulls together three streams of data that usually live in separate places: your loans, your values, and your income and expenses. The platform connects to your bank and credit card accounts to automatically import transactions, then categorizes them for you, cutting manual data entry by up to 80 percent according to Rentastic’s own reporting (Rentastic). When you clear a mortgage payment or record a rehab invoice, your performance picture adjusts.
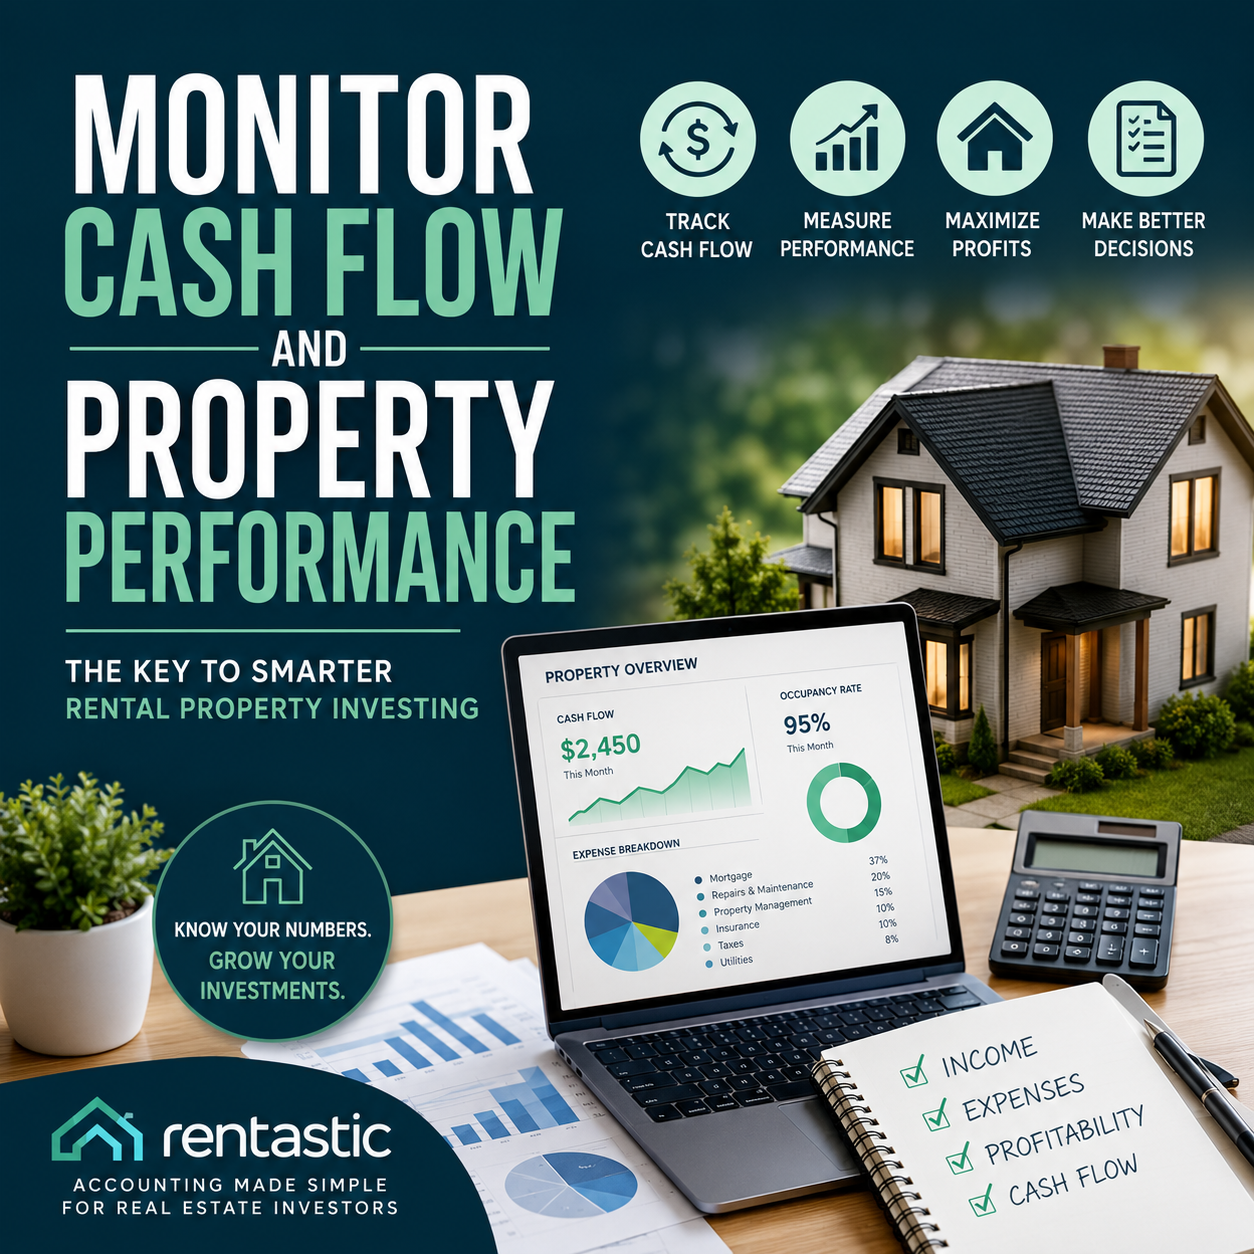
On the same dashboard, you see loan balances, property values, real time LTV, net operating income, cash flow per unit, and cap rate together in one view (Rentastic Blog). You are not just calculating a ratio. You are watching how leverage interacts with the health of each property and your portfolio as a whole.
With that visibility, your LTV stops being a number you check at refinance time. It becomes one of the live metrics in your command center that guides everyday decisions.
If you want to see whether your leverage is working, start with two questions. First, how much income is this property producing after operating expenses. Second, how does that income compare to what you have borrowed.
Rentastic calculates Net Operating Income (NOI) for you as total income minus operating expenses, with major repairs, taxes, and mortgage payments excluded. That gives you a clean view of the property’s earning power, separate from how you finance it (Rentastic).
Then you look at cash flow. Rentastic pulls in your actual mortgage payments and other recurring costs so you can see each unit’s monthly and annual cash flow in real time. You do not have to guess whether a property is still positive after insurance hikes and repairs because your cash flow per unit updates as new transactions import (Rentastic).
When you pair that with LTV inside rentastic, useful patterns show up quickly. High LTV and strong positive cash flow may point to a high performing but leveraged asset. Low LTV and weak cash flow might highlight trapped equity that is not earning enough. You can then decide whether to refinance, sell, or improve the unit rather than holding it by default.
Cap rate tells you how much return the property’s income generates relative to its value. Lenders and investors both use it as a quick read on risk and reward. Rentastic makes that calculation automatic, using your actual NOI and property values so the cap rate you see reflects real operations rather than a back‑of‑the‑envelope guess (Rentastic).
Cap rate also has limits. Rentastic notes that it misses costs like broker fees, closing costs, or upcoming repairs, so you should treat it as one lens, not a full story (Rentastic). That is why viewing cap rate beside LTV inside your dashboard is so powerful.
You might see, for example, a property with a moderate cap rate but a very low LTV. That combination can be ideal for a conservative investor. Or you might notice a strong cap rate but LTV approaching lender risk thresholds. In that case, you can use Rentastic’s portfolio tools to model whether paying down debt or raising rents slightly would keep returns solid while lowering your risk profile (Rentastic Blog).
You end up making moves based on how cap rate and LTV work together instead of chasing a single “good” percentage in isolation.
You feel the cost of debt every time interest rates shift. What is harder is translating that effect across years of ownership and multiple exit scenarios. Internal Rate of Return (IRR) and ROI help you do that, especially when you connect them to your leverage strategy.
Rentastic explains IRR as a key tool for projecting long term investment growth and cash flows so you can compare deals that have different cash flow patterns and timelines (Rentastic). When you combine that with your LTV, you can see whether extra leverage is actually lifting your long term returns or just adding stress in the short term.
You can also assess simpler ROI views. The platform lets you input buying price, repair costs, projected sale value, and renovation spending in its Deal Analyzer. You see instantly how different funding choices, down payment sizes, and rehab budgets affect your overall return on a flip or rental (Rentastic Blog).
Here is where Rentastic’s lender ready clarity becomes practical. During the high interest rate environment of summer 2025, landlords who used Rentastic’s financial tools cut their effective borrowing cost from 8 percent to 4.1 percent on a 235,000 dollar purchase and unlocked 60,000 dollars of instant equity because they could present clean numbers and evaluate multiple lending options side by side (Rentastic.io Blog). That kind of clarity comes from pairing leverage metrics with real performance data, not from guessing what a bank wants to see.
One of the quietest risks in a growing portfolio is the slow rise of leverage across markets you own in. A few cash out refis, a value add project that runs over budget, and a price softening in one submarket can push some units close to lender thresholds without you noticing until a refinance turns difficult.
Rentastic is designed to help you catch that shift before it becomes a problem. Its dashboard lets you view loan amounts, property values, and LTV for each property and across your portfolio in real time (Rentastic Blog). You are not pulling separate reports from lenders, appraisal sites, and spreadsheets. You have one portfolio‑wide view of leverage.
The platform also flags over‑leveraged properties that sit near typical lender caps. You can then decide whether to slow new borrowing on that asset, allocate extra principal payments, or time a strategic sale. Because you see cash flow, NOI, and cap rate beside that leverage, you can balance risk with return instead of reacting to one metric at renewal time.
Snap decisions during rate spikes become thoughtful moves because you already have leverage profiles for every property at your fingertips inside rentastic.
Value add projects are one of the fastest ways to grow equity and cash flow, but they are also where leverage can get away from you. It is easy to stack rehab costs on short term loans, then hope future rents and values bail you out.
Rentastic helps you plan those plays with grounded numbers. Its Deal Analyzer lets you plug in your purchase price, renovation budget, and projected post rehab value. You instantly see how the new LTV and expected ROI line up before you commit capital (Rentastic Blog).
Once the project is underway, the platform automatically tracks your actual spend as you snap receipts, log contractor payments, and import charges from linked bank accounts (Rentastic). You can see in real time if you are drifting over budget and how that drift changes your eventual LTV.
If you end up with a higher than planned LTV but strong NOI and rising rents, Rentastic’s performance metrics help you make a sober call on whether to refinance into a long term loan, hold, or sell. You move from “We hope this works out” to “Here is how the leverage and returns pencil out with real numbers.”
Spreadsheets can track a few units, but once you hold several properties in different markets, your leverage picture gets blurry. Rentastic is built as a central command center so you can check portfolio health in minutes, not hours.
The dashboard brings together LTV ratios, NOI, cap rate, net cash flow per unit, and overall portfolio cash flow in one place (Rentastic Blog). Because your bank feeds import automatically and the system learns your tagging habits, manual bookkeeping drops by up to 70 percent and errors fall by more than 60 percent (Rentastic.io Blog).
That time savings matters because it lets you review leverage and performance regularly instead of once per year at tax time. Rentastic itself recommends checking key metrics and comparative market data on a recurring basis so you can make smart moves in a dynamic environment (Rentastic).
With automated profit and loss reports and portfolio level value tracking, you can also answer bigger questions. How much of your equity sits in low performing but low leverage units. Where could a refinance or 1031 exchange unlock better IRR. Which markets in your portfolio show improving cap rates and lower risk.
You are managing an integrated system, not a pile of unrelated properties.
When you connect LTV to live income, expenses, and values, leverage stops being a blunt risk factor and becomes a dial you can tune to shape your returns.
Healthy leverage is easier to carry when your cash flow is steady. Rentastic treats cash flow management as part of your leverage strategy, not a separate chore, because the platform is designed from the ground up as real estate accounting software for landlords.
By linking your financial accounts, Rentastic imports new income and expenses automatically and updates cash flow across your portfolio in real time (Rentastic). That saves you time and also surfaces trends early, such as rising utilities or maintenance that might threaten your debt coverage.
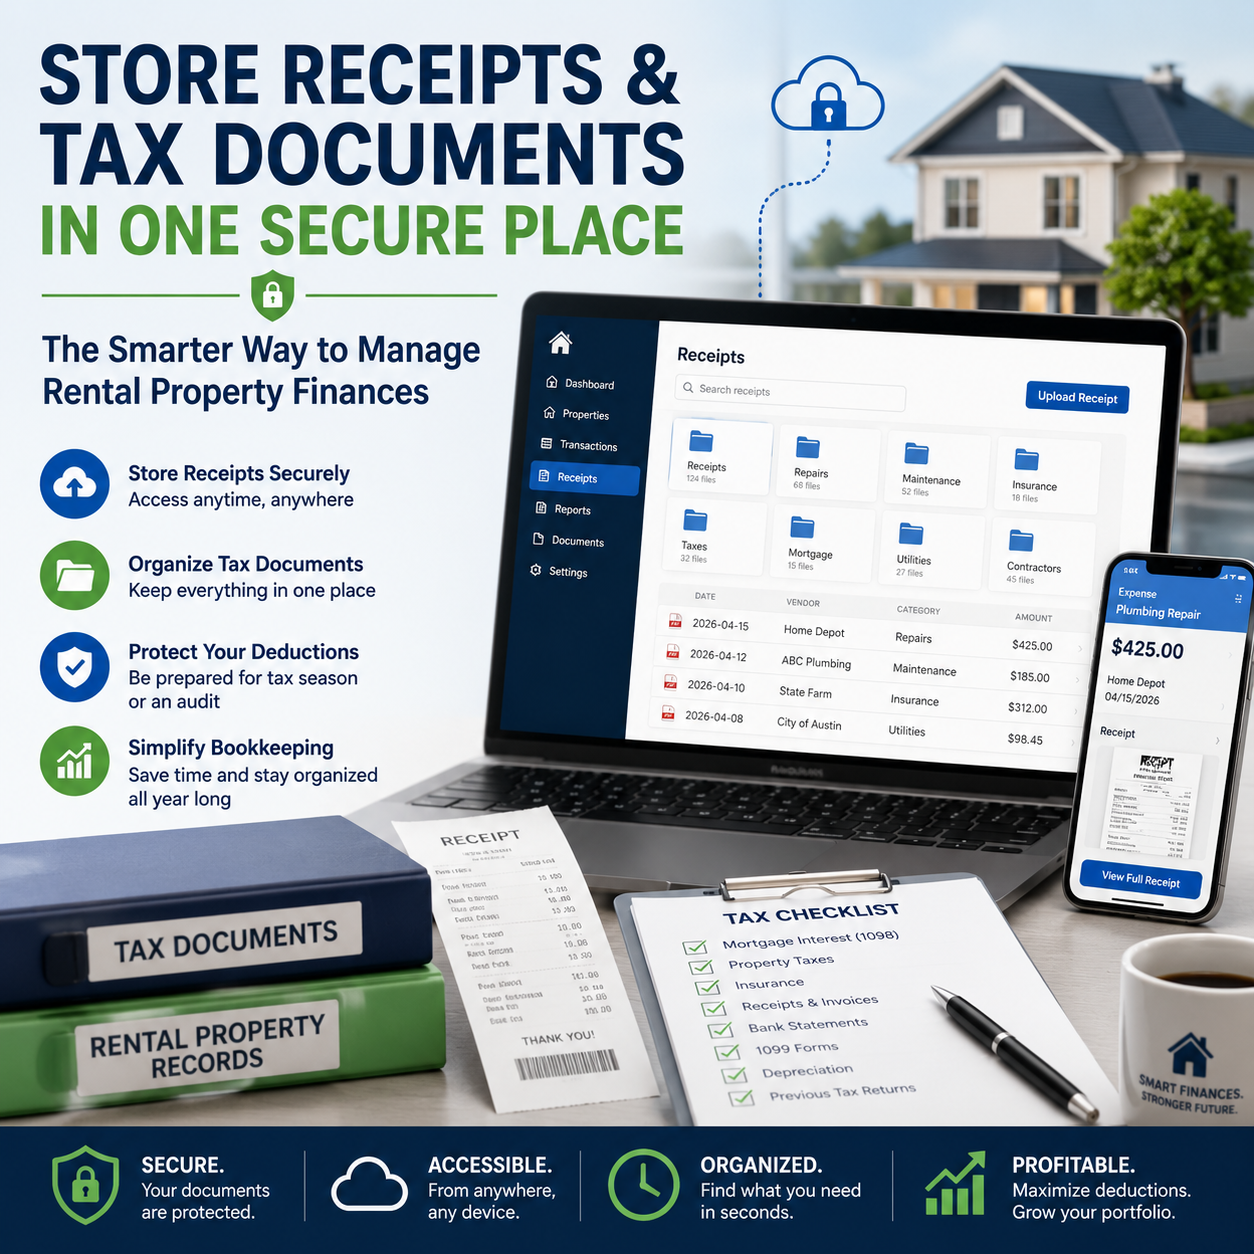
The platform makes it easy to track receipts by letting you snap photos and tie them to specific transactions. This cuts the risk that unrecorded expenses will quietly erode your true returns (Rentastic). Profit and loss reports generate in seconds so you can review performance monthly, not just when your accountant asks for numbers (Rentastic).
That level of clarity is not just convenient. Rentastic found that nearly one in four landlords report unexpected expenses wiping out part of their rental income, which is exactly the kind of surprise that can make your leverage feel risky overnight (Rentastic). With clean cash flow tracking and alerts for potential issues, you can adjust rents, cut costs, or restructure debt before that happens.
When you apply for new financing or a refinance, you often scramble to assemble income statements, expense breakdowns, and updated LTV numbers. That scramble can cost you time, and sometimes it costs you the best rates.
Rentastic flips that dynamic because your books, metrics, and documents are already organized. Automated expense categorization and real time income tracking mean your reports reflect reality, not a rough guess you pulled together the night before the bank call (Rentastic Blog).
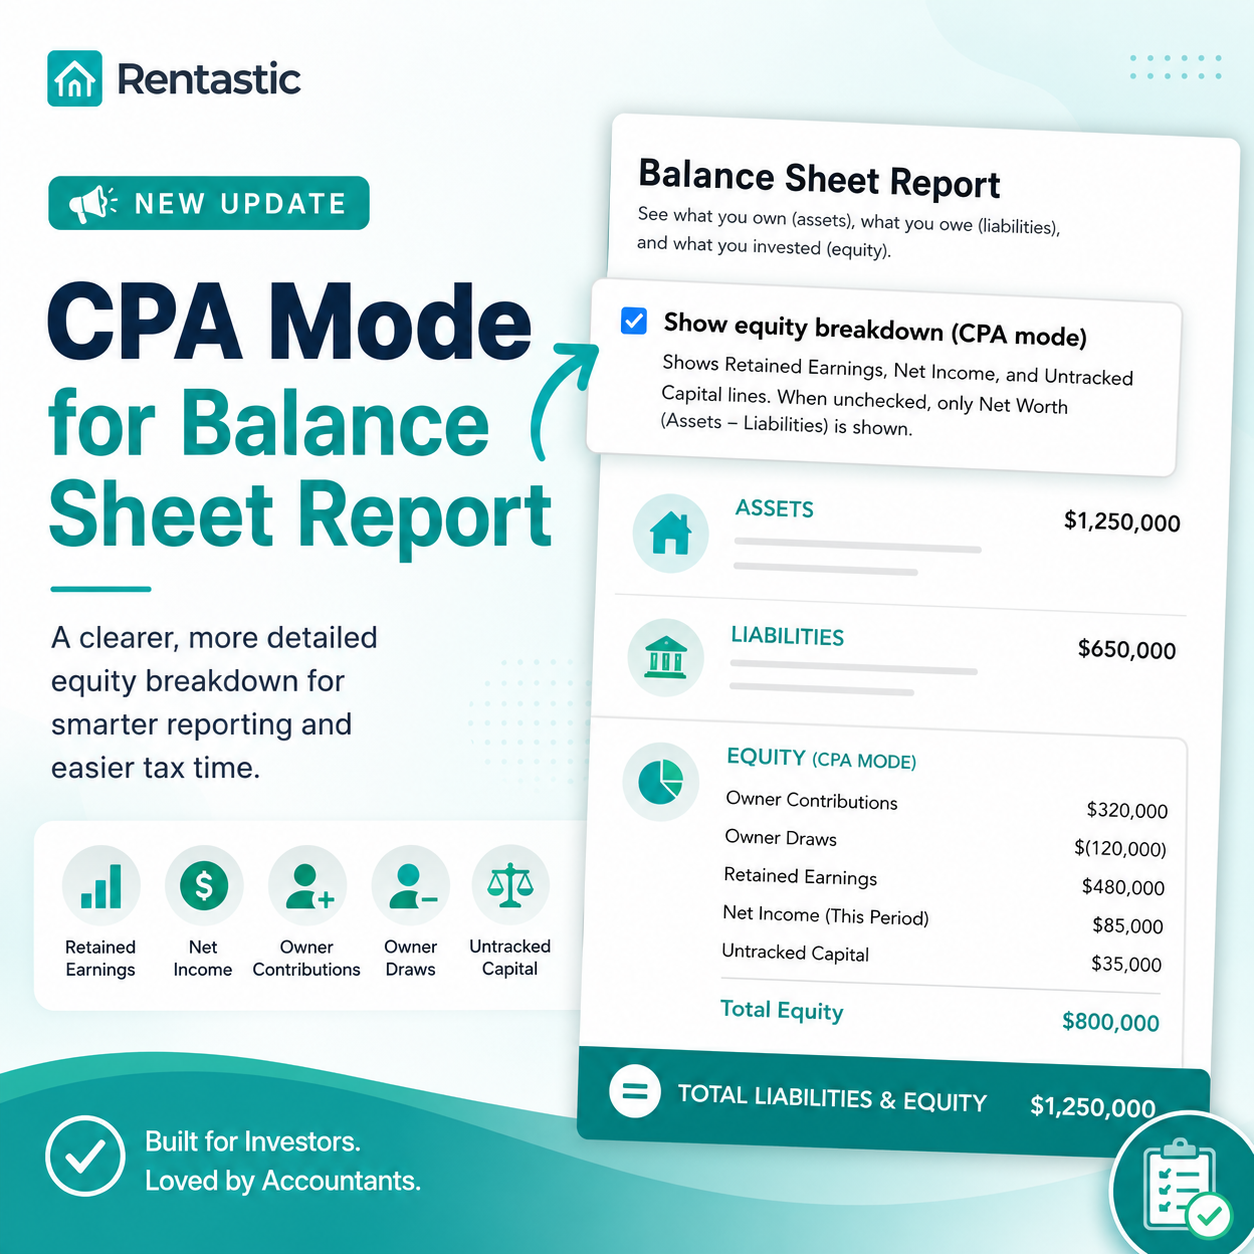
With a few clicks, you can generate property level P and L statements and portfolio summaries that include NOI, cap rate, and cash flow per unit on the same page as LTV (Rentastic). Lenders see a clear, professional picture of how you manage leverage and performance, which can support more favorable terms.
In practice, this kind of lender ready clarity helped users cut their effective borrowing costs significantly even in a tough rate environment and unlock sizable equity at purchase (Rentastic.io Blog). If you want debt to work for you, being the investor with clean, current numbers is a simple advantage.
You already track leverage. The shift that pays off is tying that leverage tightly to the actual performance of your properties. Rentastic is built for that link. It shows LTV beside NOI, cap rate, cash flow, and ROI so you can see how every borrowed dollar affects your risk and your returns across the whole portfolio.
If you want to spend less time in spreadsheets and more time making decisions, explore rentastic. Connect your accounts, let the platform do the bookkeeping, and start reviewing your LTV and performance metrics in one clear dashboard. Small, informed adjustments to leverage can compound into a safer, more profitable portfolio over the next cycle.
RECENT POSTS


© 2025 Rentastic
Rentastic is registered as a trademark. Terms and conditions, features, support, pricing, and service options subject to change without notice.


.png)


Comments