
Whether you’re adding smart locks or installing in-unit laundry, you need clarity on every dollar spent and earned. In this guide, from smart locks to in-unit laundry: how to track amenity costs vs. returns in one dashboard, you’ll learn how to centralize your upgrade expenses, rental income boosts, occupancy shifts, and net operating income—all in one place. By the end, you’ll have a step-by-step approach to measuring the true impact of amenities on your bottom line and the confidence to optimize your property portfolio.
Getting clear on amenity return on investment (ROI) is the first step toward profitable upgrades. Rather than relying on gut feelings or scattered spreadsheets, you’ll define costs, quantify returns, and see why a single dashboard matters.
When you budget for upgrades, consider:
For smart locks, costs might include device units, installation labor, and gateway subscriptions. In-unit laundry often carries higher installation fees, plumbing work, and utility hookups. Tracking each line item ensures nothing slips through the cracks.
Amenity returns go beyond the sticker rent you charge:
If smart locks let you automate self-showings, you may fill vacancies 20% faster. In-unit laundry can justify an extra $30 to $50 per month in rent—and even generate coin-op revenue. Assign dollar values to each benefit to compare apples to apples.
Juggling multiple spreadsheets and apps creates blind spots. With one dashboard, you can:
Instead of bouncing between bank statements and lease files, you’ll have a real-time snapshot of ROI. For a deeper dive into which features drive the biggest gains, check out our guide on which rental amenities actually increase roi? track the real impact with rentastic.
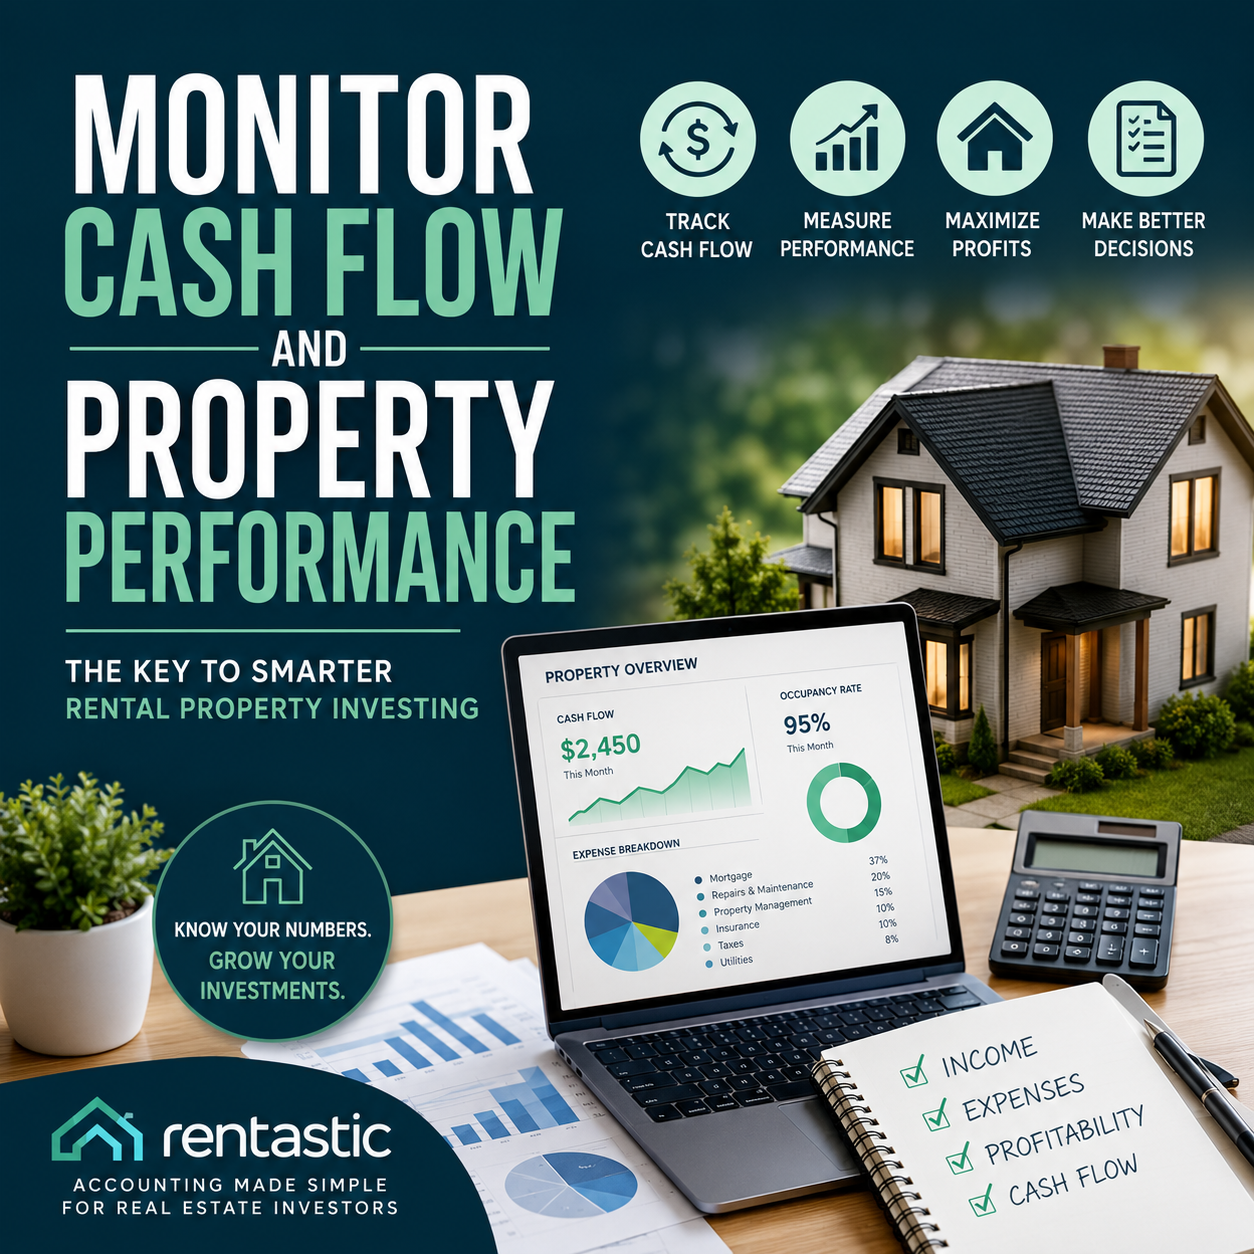
Manual bookkeeping and scattered records slow you down. Rentastic gives you an all-in-one platform to import transactions, generate reports, and visualize trends—no more stitching together spreadsheets.
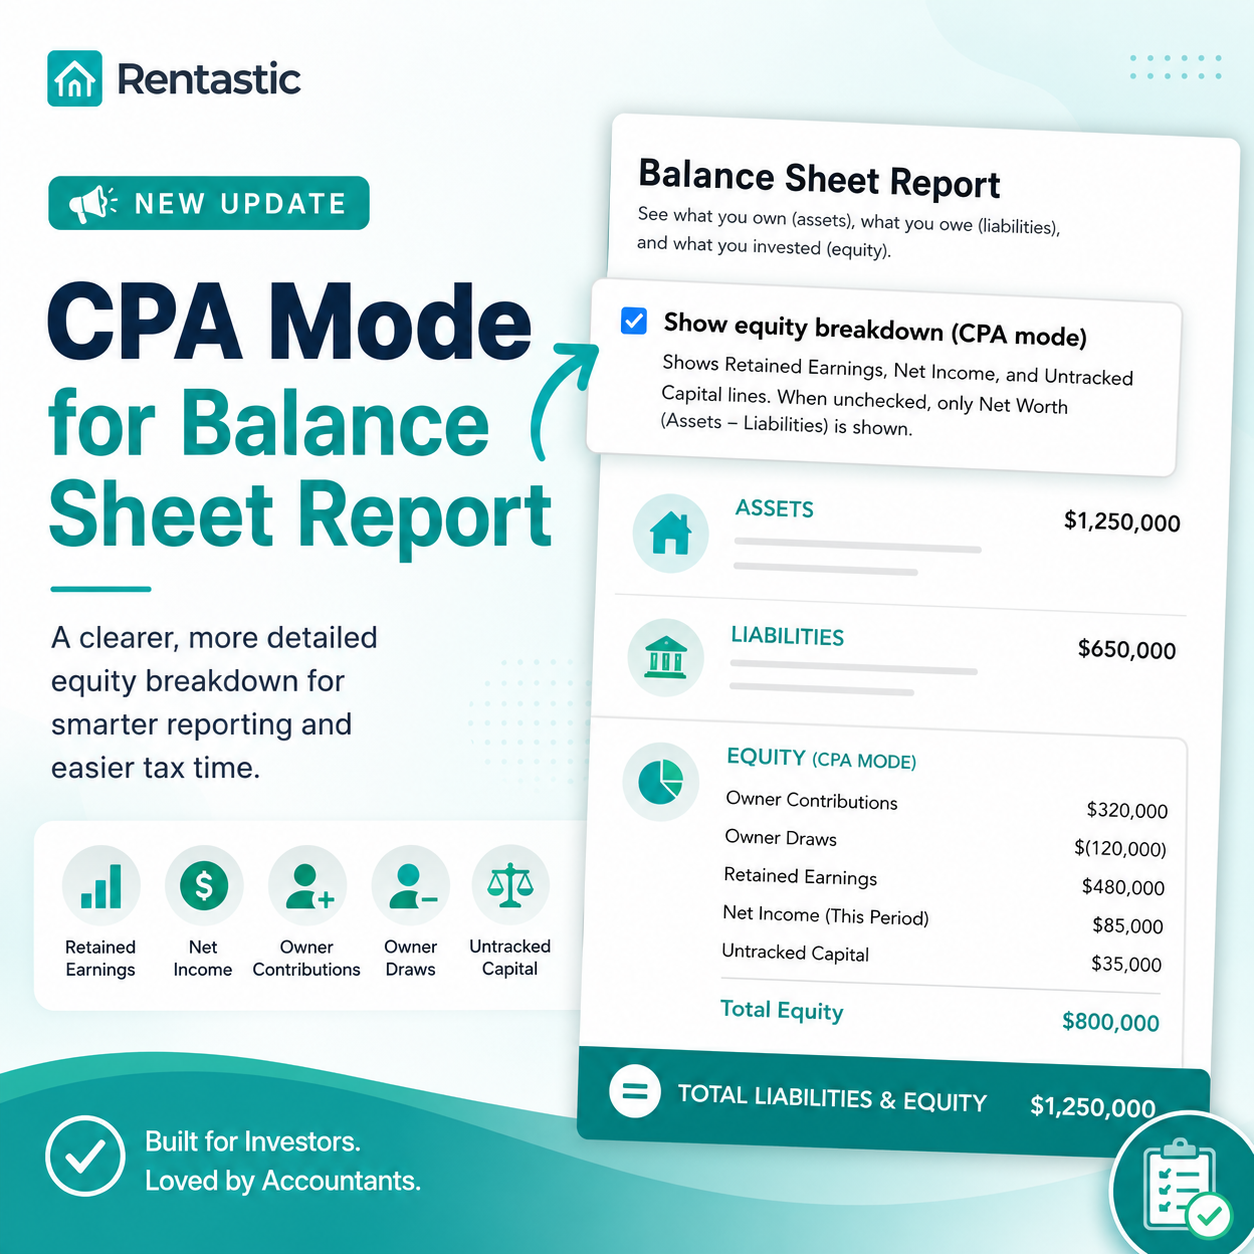
Rentastic links directly to your bank accounts and credit cards, automatically categorizing income and expenses. Within seconds you’ll have:
These reports draw on the same data set, so your calculations never contradict. For example, the Profit and Loss Statement report compiles income and expense data in one view, making tax time seamless (Rentastic).
Beyond raw numbers, you need visuals to catch shifts early. Rentastic’s dashboard widgets let you:
You can filter by property, amenity type, or date range. Within weeks you’ll see which investments pay off and which require a second look (Rentastic).
Setting the right rent premium affects both returns and vacancy. Rentastic’s Rent Estimates feature uses market data to suggest competitive prices by comparing similar properties nearby. Sync ever-changing local rates with your dashboard to:
With data-driven pricing, you’ll see ROI estimates update automatically as rent figures change (Rentastic).
Before you commit capital, run scenarios to forecast outcomes. Rentastic’s Deal Analyzer gives you the tools to model multiple amenities side by side and pick the winners.
Open the Deal Analyzer and enter your variables:
The tool calculates your break-even point, internal rate of return (IRR), and net present value (NPV) so you can compare financing options and down payments with confidence (Rentastic).
Imagine you’re debating:
With Deal Analyzer you’ll see:
You may discover that lower-cost smart locks pay back in four months, while laundry takes nine months but delivers a stronger NOI boost in year two.
Assumptions change, so test alternative scenarios:
By tweaking sliders, you’ll spot risk thresholds and plan for worst-case or best-case outcomes. That way, even if market rents dip or supply chain delays increase costs, you’re ready.
With data flowing into Rentastic, it’s time to refine your approach. Use these tactics to make every upgrade count.
Build a dashboard focused on your top metrics:
Monitor weekly or monthly so you catch trends—downward spikes in ROI can trigger a timely maintenance check or rent adjustment.
“Amenity creep” happens when small features add up into big, unprofitable investments. To keep your budget in check, follow our guide on amenity creep is real: how landlords can avoid overspending on upgrades that don’t pay off. You’ll learn to set clear ROI thresholds and stick to upgrades that meet your targets.
Some amenities move the needle on tenant demand more than others. If lowering vacant days is your priority, explore our article on how amenities affect vacancy rates (and how rentastic helps you prove it). It shows which features attract faster applicants and how to quantify the impact in your dashboard.
Not every building needs in-apartment laundry or private lounges. Sometimes shared amenities deliver higher returns at lower cost. To weigh the trade-offs for small portfolios, see shared amenities vs. in-unit upgrades: which delivers better returns for small landlords?. You’ll get a side-by-side look at capex, rent premiums, and tenant appeal.
Amenity performance shifts over time. Schedule quarterly reviews where you:
By closing the loop, you turn each upgrade into a data point that sharpens your next investment decision.
Tracking amenity costs vs. returns in one dashboard transforms guesswork into strategic action. You’ll know exactly how smart locks, in-unit laundry, and every other upgrade affect your cash flow, ROI, and vacancy. With Rentastic’s automated bookkeeping, real-time dashboards, deal modeling, and scenario testing, you can make informed decisions, avoid costly missteps, and fine-tune your amenity strategy over time.
Start by importing your recent transactions into Rentastic, set up KPI widgets for ROI and occupancy, and run a Deal Analyzer simulation on your next planned upgrade. As you gather real-world data, you’ll build a feedback loop that turns insights into higher NOI and happier tenants. Now it’s your turn to take control of amenity tracking and unlock lasting returns on your rental investments.
RECENT POSTS


© 2025 Rentastic
Rentastic is registered as a trademark. Terms and conditions, features, support, pricing, and service options subject to change without notice.


.png)


Comments