
Where you live determines everything about your real estate experience in 2025
The American housing market has officially split into two distinct worlds. While some regions see homes flying off the market with multiple offers, others are watching inventory pile up as prices finally start to cool. Understanding which market you’re in has never been more critical for real estate investors.
Stay ahead of regional market shifts with our comprehensive property tracking tools. Monitor your portfolio’s performance across different markets and get instant insights into cap rates, cash flow per unit, and annual NOI to make data-driven investment decisions.
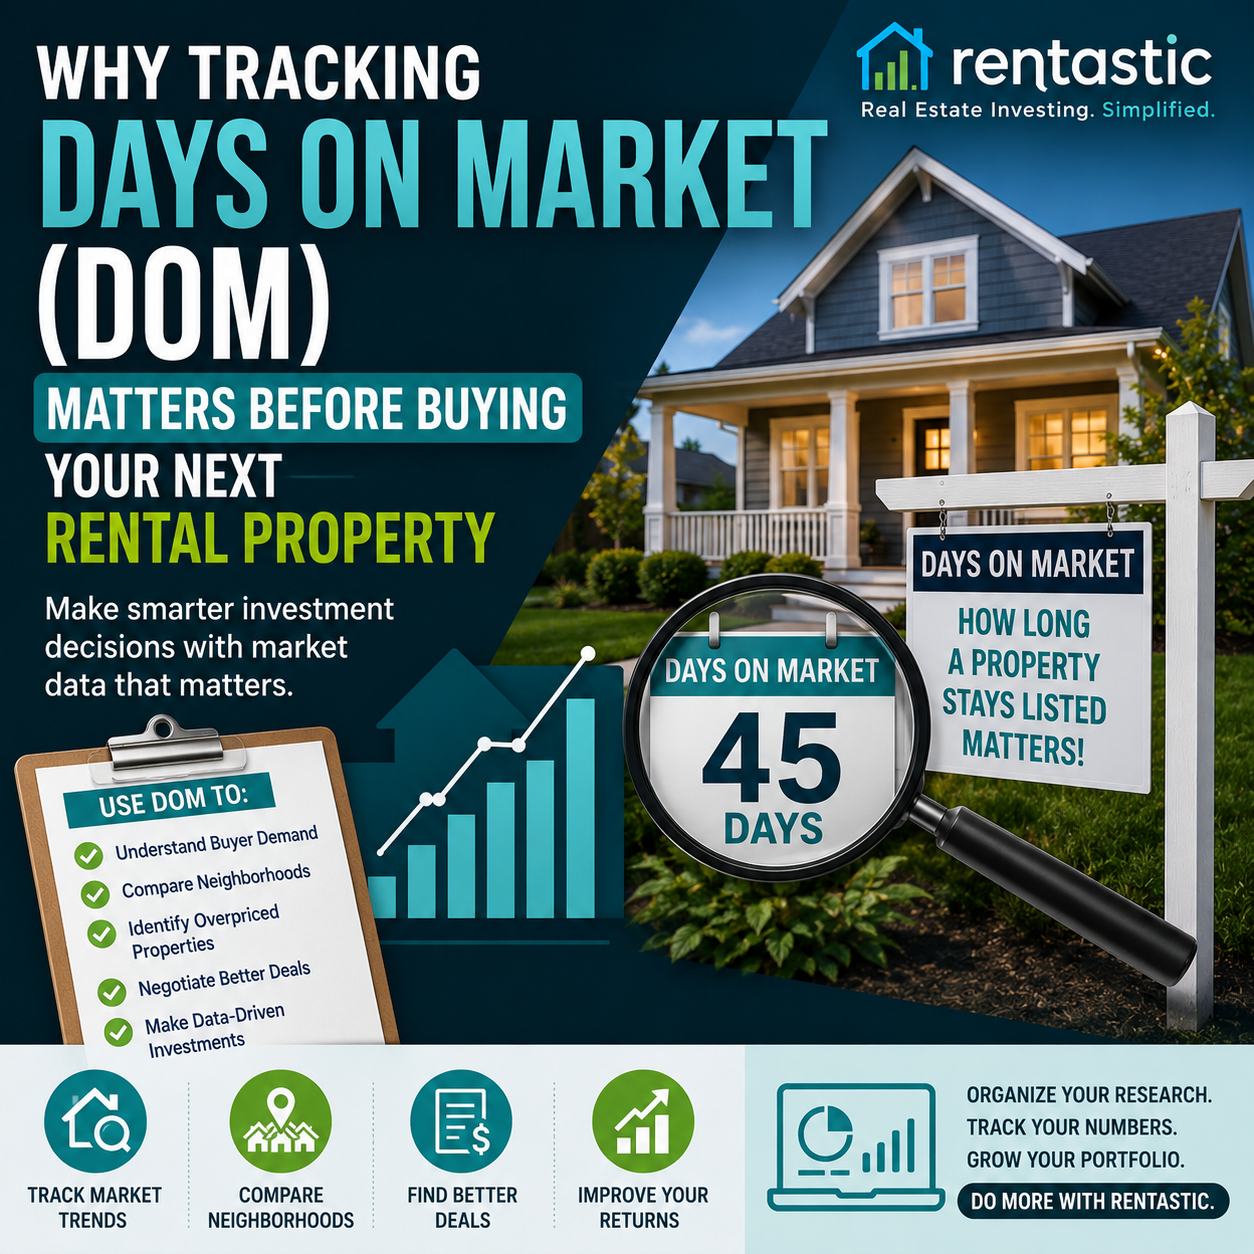
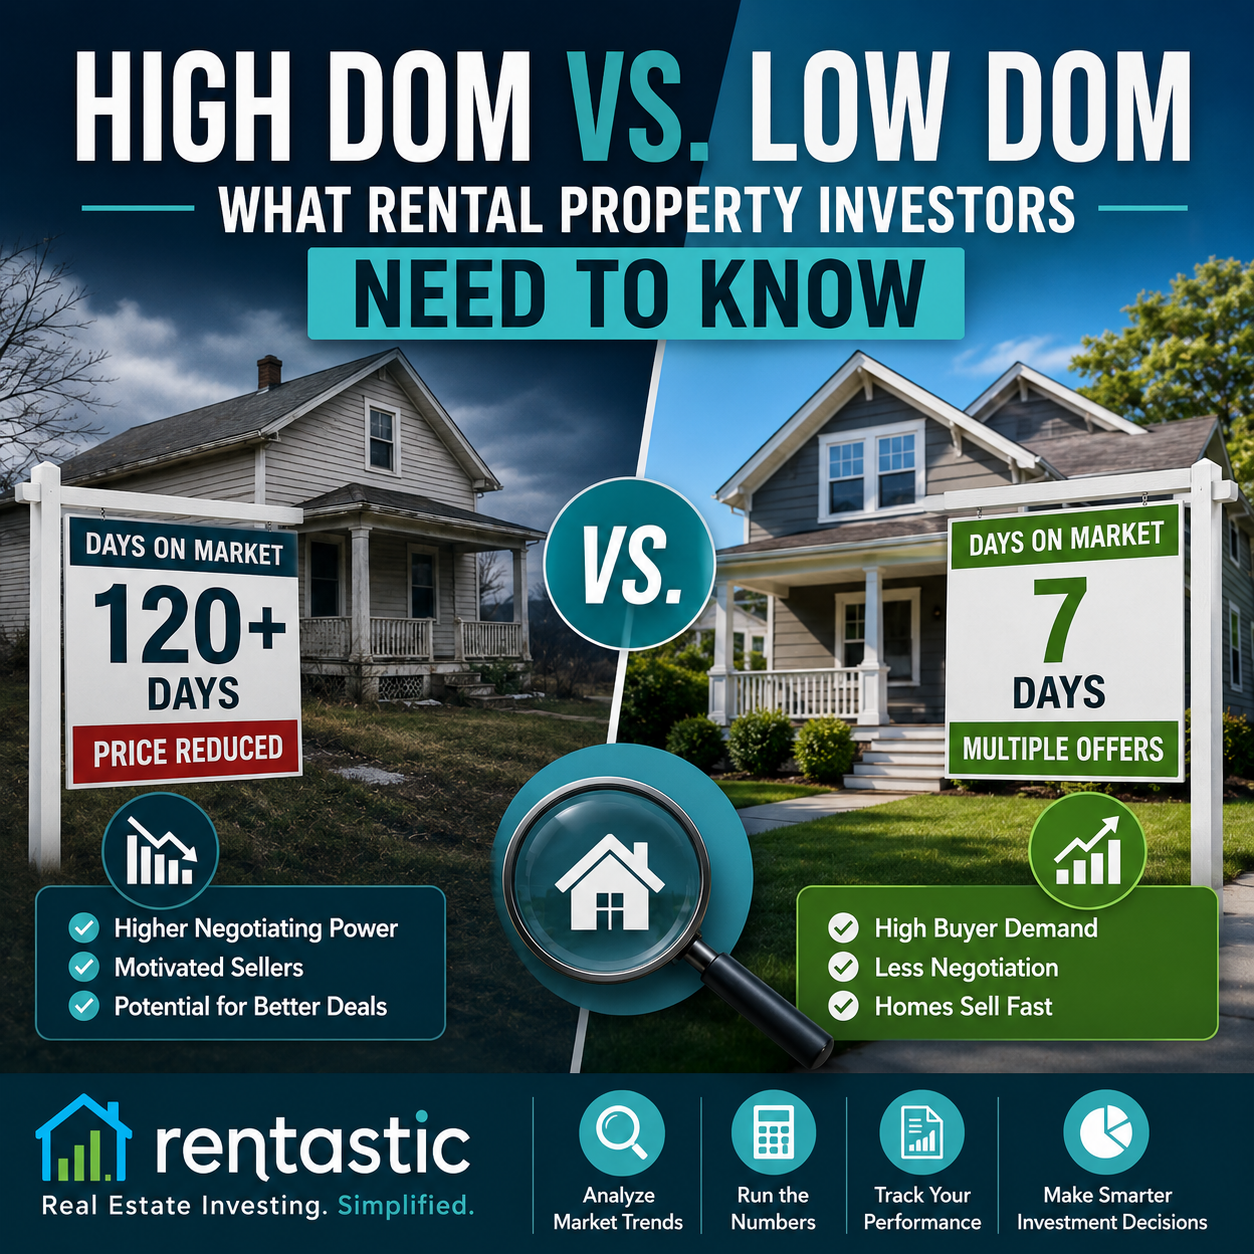
Markets in the South and West are experiencing the most dramatic shifts. Inventory has surged, homes are staying on the market 20% longer than pre-pandemic levels, and for the first time in years, buyers have negotiating power.
Key indicators:
Northern markets remain tight with limited inventory and continued price growth. These regions are seeing more stable conditions with less dramatic swings in either direction.
Key indicators:
Make informed decisions about rental pricing across different markets. Our premium Rent Estimate tool analyzes local comparables by address, bedroom count, bathroom count, and square footage to optimize your rental strategy in any market condition.
The dream of 3% mortgages is officially over. Current rates hover around 6.78%, and experts predict they’ll stay in the 6.5–7% range through 2025. The Federal Reserve has signaled patience with inflation, meaning no major rate drops are expected until late 2025 at the earliest.
Stop waiting for rates to fall. Four in five homebuyers are still waiting for lower rates, but prices continue rising while they wait. Smart investors are adapting with creative financing, rate buydowns, and focusing on cash flow rather than perfect interest rates.
The “lock-in effect” continues to dominate the market. With 82% of existing mortgage holders locked into rates below 6% (and 25% below 3%), homeowners are reluctant to sell and give up their low rates. This creates an artificial supply constraint that keeps inventory tight in many markets.
High interest rates don’t have to kill your deals. Use Rentastic’s Premium Cash Flow Reports to analyze income details, expense types, and net cash flow. Our tools help you identify profitable properties even in today’s higher-rate environment.
After years of severe shortages, housing inventory is finally growing. Unsold homes are up 29% year-over-year, marking the most significant inventory increase since the pandemic began. But this growth is far from uniform across the country.
New construction inventory has reached levels not seen since 2007–2008, with builders offering unprecedented incentives:
However, this inventory growth comes with a caveat: it’s driven more by sluggish sales than by a flood of new listings. Homes are simply taking longer to sell rather than massive numbers of sellers entering the market.
National home price growth has slowed to just 1.3% annually—the slowest pace in two years. But the regional story varies dramatically:
Nearly one-third of major markets are now seeing year-over-year price declines of at least one percentage point. This represents a significant shift from the pandemic-era price surge that affected virtually all markets simultaneously.
Keep tabs on your property values with Rentastic’s intuitive LTV pie graphs and property tracking features. Visualize your property’s financial health and track market value changes to understand how regional trends impact your specific investments.
Location strategy is everything. Success in today’s market depends entirely on understanding your specific regional dynamics and adjusting your approach accordingly.
Streamline your investment analysis with automatic bank account linking and receipt scanning. Track rental income, expenses, and cash flow across multiple properties and markets without the spreadsheet headaches.
The National Association of Realtors predicts existing home sales will increase 7–12% in 2025, suggesting the market is slowly thawing. However, affordability remains at its worst levels in decades, with the typical mortgage payment reaching $2,290—the highest ever recorded.
The market is normalizing, but this “normal” looks different from the pre-pandemic era. Investors who adapt to the new reality will find opportunities, while those waiting for a return to 2020–2021 conditions may miss the current cycle entirely.
Whether you’re navigating a buyer’s market in Phoenix or competing in Boston’s tight inventory, Rentastic gives you the tools to succeed. From automated expense tracking to comprehensive cash flow analysis, we help investors make smarter decisions in any market condition.
Start Your Free Trial Today → https://www.rentastic.io/pricing
This newsletter synthesizes data from the National Association of Realtors, Bankrate, ICE Mortgage Technology, U.S. News Housing Market Index, JPMorgan Research, CNBC, and various regional MLS systems. All statistics current as of July 2025 unless otherwise noted.
RECENT POSTS


© 2025 Rentastic
Rentastic is registered as a trademark. Terms and conditions, features, support, pricing, and service options subject to change without notice.


.png)


Comments