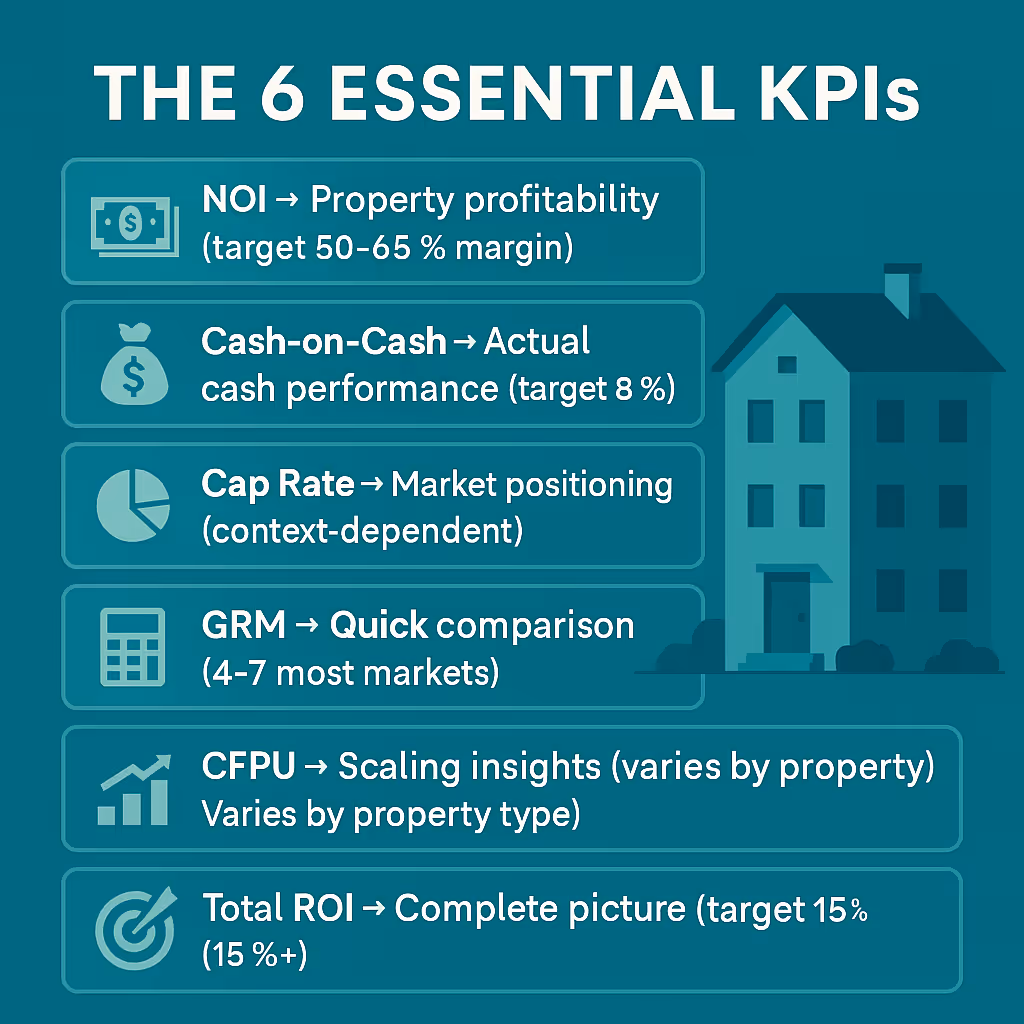
The 6 essential KPIs
NOI → Property profitability (target 50-65% margin)
Cash-on-Cash → Actual cash performance (target 8-12%)
Cap Rate → Market positioning (context-dependent)
GRM → Quick comparison (4-7 most markets)
CFPU → Scaling insights (varies by property type)
Total ROI → Complete picture (target 15%+)
Net Operating Income (NOI) The Foundation
What its is: Gross rental income minus operating expenses (excludes mortgage payments)
Why it's critical:
- Shows true property profitability before financing
- Used to calculate property value (NOI ÷ Cap Rate = Value)
- Directly impacts your wealth building
Current Industry Benchmarks:
- NOI Margin: 50-65% (NOI ÷ Gross Income)
- Red Flag: Below 40% indicates operational problems
Cash-on-Cash Return - Your Real Performance
What it is: Annual Cash Flow ÷ Total cash invested
Why it matters: Shows actual cash performance on your investment
Current Market Benchmarks:
- Conservative target: 6-8%
- Good performance: 8-12%
- Excellent performance: 12%+
Cap Rate - Market Positioning
What it is: NOI ÷ Current property value
Why it's essential:
- Compares properties accross different markets
- Shows if you're in appreciation vs. income play
- Indicates market risk level
Current Market Benchmarks:
- Stable Markets: 4-5%
- Growth markets: 6-8%
- Value-add opportunities: 8-12%
Gross Rent Multiplier (GRM*) - Quick Comparison Tool
What it is: Property purchase price ÷ Annual gross rent
Why it's useful:
- Quick property comparison
- Market Valuation check
- Deals creating tool
Market Benchmarks:
- Most Markets: 4-7 GRM
- High-appreciation areas: 8-12 GRM
- Cash flow markets: 3-6 GRM
Cash Flow Per Unit (CFPU) - Scaling Insights
What it is: Annual cash flow ÷ Number of units
Why it's valuable:
- Scales across different property sizes
- Helps identify rofitable property types
- Guides portfolio expansion decisions
Benchmarks by Property type:
- Single family: $200 - 500/month CFPU
- Duplex: $150 - 400/month CFPU
- Small multifamily: $100 - 300/month CFPU
Total Return on Investment (ROI) - The Complete Picture
What it is: (Annual Cash Flow + Appreciation + Principal Paydown) ÷ Total Investment
Why it's crucial: Shows complete investment performance, not just cash flow
Real Example Calculation:
- Annual cash flow: $6,000
- Annual appreciation: $15,000 (property value increase)
- Principal paydown: $4,000
- Total annual return: $25,000 (sum of the 3 above)
- Total investment: $75,000
- Total ROI: 33.3%
How Rentastic Helps
The Problem Most Investors Face:
- Data scattered: Bank statements, spreadsheets, shoebox of receipts
- Manual calculations: Prone to errors, time consuming
- Reactive management: Only discover problems after they're expensive
Rentastic's Solution:
- Automated Data Collection
- Bank integration: Direct connection to accounts
- Receipt management: Bulk upload and categorization
- Expense tracking: Automatic categorization with learning
Premium Reports That Drive Decisions
Profit & Loss Statements:
- Detailed NOI breakdown by property
- Expense categorization for Optimization
- Year-over-year comparison
Cash Flow Reports:
- Monthly cash flow tracking
- Indetify seasonal patterns
- Cash-on-cash perfomance
Tools and More
Deal Analyzer:
- Instant cap rate and CFPU calculations
- Compare potential investments
- Model different scenarios
Bulk Export Capabilities:
- Transaction data for tax prep
- Portfolio performance reports
- Investor presentations
Making Smarter Investment Decisions
Before Proper KPI Tracking:
- "Should I buy this property?" → Gut feeling decision
- "Is this property performing well?" → Just look at rent collected
- "Which property should I sell?" → Emotional attachment
After Comprehensive KPI Tracking:
- Acquisition decisions: Compare cap rates, GRM, projected cash-on-cash
- Performance optimization: Identify properties with low NOI margins
- Portfolio strategy: Focus on property types with highest CFPU
- Exit timing: Sell when total ROI projections decline
Call to Action & Implementation
Your Next Steps:
Audit your current KPI knowledge: Can you calculate these 6 metrics for each property?
Start tracking immediately:
- Try Rentastic for free, spread the word
- Premium upgrade for advanced KPI reporting
Set performance benchmarks:
- NOI margin >50%
- Cash-on-cash >8%
- Total ROI >15%
Monthly KPI review: Track trends and identify opportunities
Key Takeaways Summary
The 6 Essential KPIs:
- NOI - Property profitability (target 50-65% margin)
- Cash-on-Cash → Actual cash performance (target 8-12%)
- Cap Rate → Market positioning (context dependent)
- Gross Rent Multiplier (GRM) → Quick comparison (4-7 most markets)
- CFPU → Scaling insights (varies by property type)
- Total ROI → Complete picture (target 15%+)
Success Formula:
Accurate Data + Automated Tracking + Regular
Analysis = Optimized Portfolio Performance


.png)


Comments